Last time I posted I was still months away from having a baby, now I have a four month old. Time to get back into blogging. I have some things specifically about babies and being a working mother and so on, but those will have to wait.
A few weeks ago I asked around on Twitter about creating leaderboards, but couldn’t find a lot out there that worked for exactly what I needed. I was trying to make a simple application for a staff summer reading program that would allow participants to register the pages they’ve read and leave reviews, but without a lot of bureaucracy and overhead. The main tool I found was Leaderboarded, which was interesting, but way too much for the very simple thing I was trying to do. While I could have created a form on our website using Drupal or one of our PHP forms, I figured that the much easier solution would be to use a Google Form, since otherwise it would have been very difficult for the people running the program to monitor participation unless I built an entire web application, which was overkill for a temporary program.
After poking around a bit, I found this super simple solution from David Hay at the Elk Island Public Schools (in Alberta!) Technology blog. Create a form in Google Forms that asks for a name, and then any points to which the student is entitled. Then use pivot tables with the spreadsheet to get totals, and use charts to visualize these. This was very simple, and I also appreciated his script that copies formulas to the last row of the spreadsheet as people add new entries. This of course assumes you have a unique key of a person’s name added the same way each time, which for a small group of people for a short amount of time is probably a reasonable assumption.
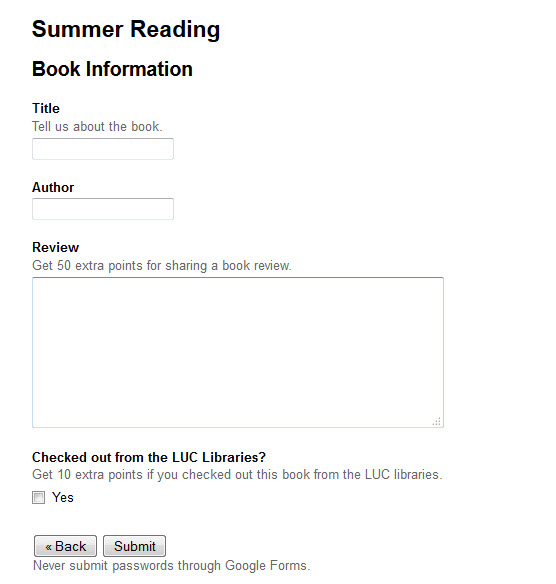
Here’s what I ended up with. You won’t be able to complete the form without Loyola email address (to hopefully prevent spam), but here’s what happens. Most of the time people will just be entering the pages they read last, and won’t need to add anything else. They will fill in that information, and then submit the form. But if they’ve finished a book, they can leave a review for more points. Clicking the “Did you finish a book?” radio button will take them to page 2, which is below. They can fill in author and title only, or add a review for 50 points. They also get an additional 10 points for checking the book out of the LUC libraries.
On the back end, this form records to a spreadsheet. The points are added up in an additional column I added to the spreadsheet. It adds in additional points for the challenges to the pages read using conditionals, which I’d not really used in Google Forms before. They work just as you would expect.
=C2 [pages read]+(if(J2[LUC libraries]="Yes",10[condition if true],0[condition if false])+if(isblank(I2)[review box],0[condition if true],50[condition if false))
Then I use a series of pivot tables and charts to add up the total points for each person (which we will use internally for entering participants in a raffle and determining the overall winner) and departmental points, which we will use to cheer on departments and try to make them compete against each other. To check for the individuals who are ahead, I use a pivot table with a row grouped by name with the sum of total points, and the same thing for departments. Then I made a bar graph sorted by total to make a departmental leaderboard to post on the website, which you can see here (as of publication it’s blank since the program hasn’t started yet).
Since everything is stored in an online form, the group who is running this program will be able to make edits to the form and the data if they need to, and copy the reviews out of the spreadsheet to post on the library’s blog. Very simple, and not using a database when a spreadsheet will do!
Ahem.
.@FakeLibStats : 65% of librarians use a spreadsheet for what can be better and more easily accomplished by a database.
Academic librarians working in technical roles may rarely see stacks of books, but they doubtless see messy digital data on a daily basis. OpenRefine is an extremely useful tool for dealing with this data without sophisticated scripting skills and with a very low learning curve. Once you learn a few tricks with it, you may never need to force a student worker to copy and paste items onto Excel spreadsheets.
As this comparison by the creator of OpenRefine shows, the best use for the tool is to explore and transform data, and it allows you to make edits to many cells and rows at once while still seeing your data. This allows you to experiment and undo mistakes easily, which is a great advantage over databases or scripting where you can’t always see what’s happening or undo the typo you made. It’s also a lot faster than editing cell by cell like you would do with a spreadsheet.
Here’s an example of a project that I did in a spreadsheet and took hours, but then I redid in Google Refine and took a lot less time. One of the quickest things to do with OpenRefine is spot words or phrases that are almost the same, and possibly are the same thing. Recently I needed to turn a large export of data from the catalog into data that I could load into my institutional repository. There were only certain allowed values that could be used in the controlled vocabulary in the repository, so I had to modify the bibliographic data from the catalog (which was of course in more or less proper AACR2 style) to match the vocabularies available in the repository. The problem was that the data I had wasn’t consistent–there were multiple types of abbreviations, extra spaces, extra punctuation, and outright misspellings. An example is the History Department. I can look at “Department of History”, “Dep. of History”, “Dep of Hist.” and tell these are probably all referring to the same thing, but it’s difficult to predict those potential spellings. While I could deal with much of this with regular expressions in a text editor and find and replace in Excel, I kept running into additional problems that I couldn’t spot until I got an error. It took several attempts of loading the data until I cleared out all the errors.
In OpenRefine this is a much simpler task, since you can use it to find everything that probably is the same thing despite the slight differences in spelling, punctuation and spelling. So rather than trying to write a regular expression that accounts for all the differences between “Department of History”, “Dep. of History”, “Dep of Hist.”, you can find all the clusters of text that include those elements and change them all in one shot to “History”. I will have more detailed instructions on how to do this below.
Installation and Basics
OpenRefine was called, until last October, Google Refine, and while the content from the Google Refine page is being moved to the Open Refine page you should plan to look at both sites. Documentation and video tutorials refer interchangeably to Google Refine and OpenRefine. The official and current documentation is on the OpenRefine GitHub wiki. For specific questions you will probably want to use the OpenRefine Custom Search Engine, which brings together all the mix of documentation and tutorials on the web. OpenRefine is a web app that runs on your computer, so you don’t need an internet connection to run it. You can get the installation instructions on this page.
While you can jump in right away and get started playing around, it is well worth your time to watch the tutorial videos, which will cover the basic actions you need to take to start working with data. As I said, the learning curve is low, but not all of the commands will make sense until you see them in action. These videos will also give you an idea of what you might be able to do with a data set you have lying around. You may also want to browse the “recipes” on the OpenRefine site, as well search online for additional interesting things people have done. You will probably think of more ideas about what to try. The most important thing to know about OpenRefine is that you can undo anything, and go back to the beginning of the project before you messed up.
A basic understanding of the Google Refine Expression Language, or GREL will improve your ability to work with data. There isn’t a whole lot of detailed documentation, so you should feel free to experiment and see what happens when you try different functions. You will see from the tutorial videos the basics you need to know. Another essential tool is regular expressions. So much of the data you will be starting with is structured data (even if it’s not perfectly structured) that you will need to turn into something else. Regular expressions help you find patterns which you can use to break apart strings into something else. Spending a few minutes understanding regular expression syntax will save hours of inefficient find and replace. There are many tutorials–my go-to source is this one. The good news for librarians is that if you can construct a Dewey Decimal call number, you can construct a regular expression!
Some ideas for librarians
(A) Typos
Above I described how you would use OpenRefine to clean up messy and inconsistent catalog data. Here’s how to do it. Load in the data, and select “Text Facet” on the column in question. OpenRefine will show clusters of text that is similar and probably the same thing.
AcademicDept Text Facet
Click on Cluster to get a menu for working with multiple values. You can click on the “Merge” check box and then edit the text to whatever you need it to be. You can also edit each text cluster to be the correct text.
Cluster and Edit
You can merge and re-cluster until you have fixed all the typos. Back on the first Text Facet, you can hover over any value to edit it. That way even if the automatic clustering misses some you can edit the errors, or change anything that is the same but you need to look different–for instance, change “Dept. of English” to just “English”.
(B) Bibliographies
The main thing that I have used OpenRefine for in my daily work is to change a bibliography in plain text into columns in a spreadsheet that I can run against an API. This was inspired by this article in the Code4Lib Journal: “Using XSLT and Google Scripts to Streamline Populating an Institutional Repository” by Stephen X. Flynn, Catalina Oyler, and Marsha Miles. I wanted to find a way to turn a text CV into something that would work with the SHERPA/RoMEO API, so that I could find out which past faculty publications could be posted in the institutional repository. Since CVs are lists of data presented in a structured format but with some inconsistencies, OpenRefine makes it very easy to present the data in a certain way as well as remove the inconsistencies, and then to extend the data with a web service. This is a very basic set of instructions for how to accomplish this.
The main thing to accomplish is to put the journal title in its own column. Here’s an example citation in APA format, in which I’ve colored all the “separator” punctuation in red:
Heller, M. (2011). A Review of “Strategic Planning for Social Media in Libraries”.Journal of Electronic Resources Librarianship, 24 (4), 339-240)
From the drop-down menu at the top of the column click on “Split into several columns…” from the “Edit Column” menu. You will get a menu like the one below. This example finds the opening parenthesis and removes that in creating a new column. The author’s name is its own column, and the rest of the text is in another column.
The rest of the column works the same way–find the next text, punctuation, or spacing that indicates a separation. You can then rename the column to be something that makes sense. In the end, you will end up with something like this:
When you have the journal titles separate, you may want to cluster the text and make sure that the journals have consistent titles or anything else to clean up the titles. Now you are a ready to build on this data with fetching data from a web service. The third video tutorial posted above will explain the basic idea, and this tutorial is also helpful. Use the pull-down menu at the top of the journal column to select “Edit column” and then “Add column by fetching URLs…”. You will get a box that will help you construct the right URL. You need to format your URL in the way required by SHERPA/RoMEO, and will need a free API key. For the purposes of this example, you can use 'http://www.sherpa.ac.uk/romeo/api29.php?ak=[YOUR API KEY HERE]&qtype=starts&jtitle=' + escape(value,'url'). Note that it will give you a preview to see if the URL is formatted in the way you expect. Give your column a name, and set the Throttle delay, which will keep the service from rejecting too many requests in a short time. I found 1000 worked fine.
After this runs, you will get a new column with the XML returned by SHERPA/RoMEO. You can use this to pull out anything you need, but for this example I want to get pre-archiving and post-archiving policies, as well as the conditions. A quick way to to this is to use the Googe Refine Expression Language parseHtml function. To use this, click on “Add column based on this column” from the “Edit Column” menu, and you will get a menu to fill in an expression.
In this example I use the code value.parseHtml().select("prearchiving")[0].htmlText(), which selects just the text from within the prearchving element. Conditions are a little different, since there are multiple conditions for each journal. In that case, you would use the following syntax (after join you can put whatever separator you want): forEach(value.parseHtml().select("condition"),v,v.htmlText()).join(". ")"
So in the end, you will end up with a neatly structured spreadsheet from your original CV with all the bibliographic information in its own column and the publisher conditions listed. You can imagine the possibilities for additional APIs to use–for instance, the WorldCat API could help you determine which faculty published books the library owns.
Once you find a set of actions that gets your desired result, you can save them for the future or to share with others. Click on Undo/Redo and then the Extract option. You will get a description of the actions you took, plus those actions represented in JSON.
Unselect the checkboxes next to any mistakes you made, and then copy and paste the text somewhere you can find it again. I have the full JSON for the example above in a Gist here. Make sure that if you save your JSON publicly you remove your personal API key! When you want to run the same recipe in the future, click on the Undo/Redo tab and then choose Apply. It will run through the steps for you. Note that if you have a mistake in your data you won’t catch it until it’s all finished, so make sure that you check the formatting of the data before running this script.
Learning More and Giving Back
Hopefully this quick tutorial got you excited about OpenRefine and thinking about what you can do. I encourage you to read through the list of External Resources to get additional ideas, some of which are library related. There is lots more to learn and lots of recipes you can create to share with the library community.
Have you used OpenRefine? Share how you’ve used it, and post your recipes.
OpenRefine on Twitter. If you post something about OpenRefine on Twitter, they will usually retweet you as a way to showcase what people are doing.
Disclaimer: I was on the planning committee for Code4Lib 2013, but this is my own opinion and does not reflect other organizers of the conference.
We have mentioned Code4Lib before on this blog, but for those who are unfamiliar, it is a loose collective of programmers working in libraries, librarians, and others interested in code and libraries. (You can read more about it on the website.) The Code4Lib conference has emerged as a venue to share very new technology and have discussions with a wide variety of people who might not attend conferences more geared to librarians. Presentations at the conference are decided by the votes of anyone interested in selecting the program, and additionally lightning talks and breakout sessions allow wide participation and exposure to extremely new projects that have not made it into the literature or to conferences with a longer lead time. The Code4Lib 2013 conference ran February 11-14 at University of Illinois Chicago. You can see a list of all programs here, which includes links to the video archive of the conference.
While there were many types of projects presented, I want to focus on those talks which illustrated what I saw as thread running through the conference–care and emotion. This is perhaps unexpected for a technical conference. Yet those themes underlie a great deal of the work that takes place in academic library technology and the types of projects presented at Code4Lib. We tend to work in academic libraries because we care about the collections and the people using those collections. That intrinsic motivation focuses our work.
Caring about the best way to display collections is central to successful projects. Most (though not all) the presenters and topics came out of academic libraries, and many of the presentations dealt with creating platforms for library and archival metadata and collections. To highlight a few: Penn State University has developed their own institutional repository application called ScholarSphere that provides a better user experience for researchers and managers of the repository. The libraries and archives of the Rock and Roll Hall of Fame dealt with the increasingly common problem of wanting to present digital content alongside more traditional finding aids, and so developed a system for doing so. Corey Harper from New York University presented an extremely interesting and still experimental project to use linked data to enrich interfaces for interacting with library collections. Note that all these projects combined various pieces of open source software and library/web standards to create solutions that solve a problem facing academic or research libraries for a particular setting. I think an important lesson for most academic librarians looking at descriptions of projects like this is that it takes more than development staff to make projects like this. It takes purpose, vision, and dedication to collecting and preserving content–in other words, emotion and care. A great example of this was the presentation about DIYHistory from the University of Iowa. This project started out initially as an extremely low-tech solution for crowdsourcing archival transcription, but got so popular that it required a more robust solution. They were able to adapt open source tools to meet their needs, still keeping the project very within the means of most libraries (the code is here).
Another view of emotion and care came from Mark Matienzo, who did a lightning talk (his blog post gives a longer version with more details). His talk discussed the difficulties of acknowledging and dealing with the emotional content of archives, even though emotion drives interactions with materials and collections. The records provided are emotionless and affectless, despite the fact that they represent important moments in history and lives. The type of sharing of what someone “likes” on Facebook does not satisfactorily answer the question of what they care about,or represent the emotion in their lives. Mark suggested that a tool like Twine, which allows writing interactive stories could approach the difficult question of bringing together the real with the emotional narrative that makes up experience.
One of the ways we express care for our work and for our colleagues is by taking time to be organized and consistent in code. Naomi Dushay of Stanford University Library presented best practices for code handoffs, which described some excellent practices for documenting and clarifying code and processes. One of the major takeaways is that being clear, concise, and straightforward is always preferable, even as much as we want to create cute names for our servers and classes. To preserve a spirit of fun, you can use the cute name and attach a description of what the item actually does.
Originally Bess Sadler, also from Stanford, was going to present with Naomi, but ended up presenting a different talk and the last one of the conference on Creating a Commons (the full text is available here). This was a very moving look at what motivates her to create open source software and how to create better open source software projects. She used the framework of the Creative Commons licenses to discuss open source software–that it needs to be “[m]achine readable, human readable, and lawyer readable.” Machine readable means that code needs to be properly structured and allow for contributions from multiple people without breaking, lawyer readable means that the project should have the correct structure and licensing to collaborate across institutions. Bess focused particularly on the “human readable” aspect of creating communities and understanding the “hacker epistemology,” as she so eloquently put it, “[t]he truth is what works.” Part of understanding that requires being willing to reshape default expectations–for instance, the Code4Lib community developed a Code of Conduct at Bess’s urging to underline the fact that the community aims at inclusion and creating a safe space. She encouraged everyone to keep working to do better and “file bug reports” about open source communities.
This year’s Code4Lib conference was a reminder to me about why I do the work I do as an academic librarian working in a technical role. Even though I may spend a lot of time sitting in front of a computer looking at code, or workflows, or processes, I know it makes access to the collections and exploration of those collections better.